To view each map in this visualization series, scroll using the grey scroller bar or grey arrows below. You may also click on each of the grey boxes (or tabs) below.
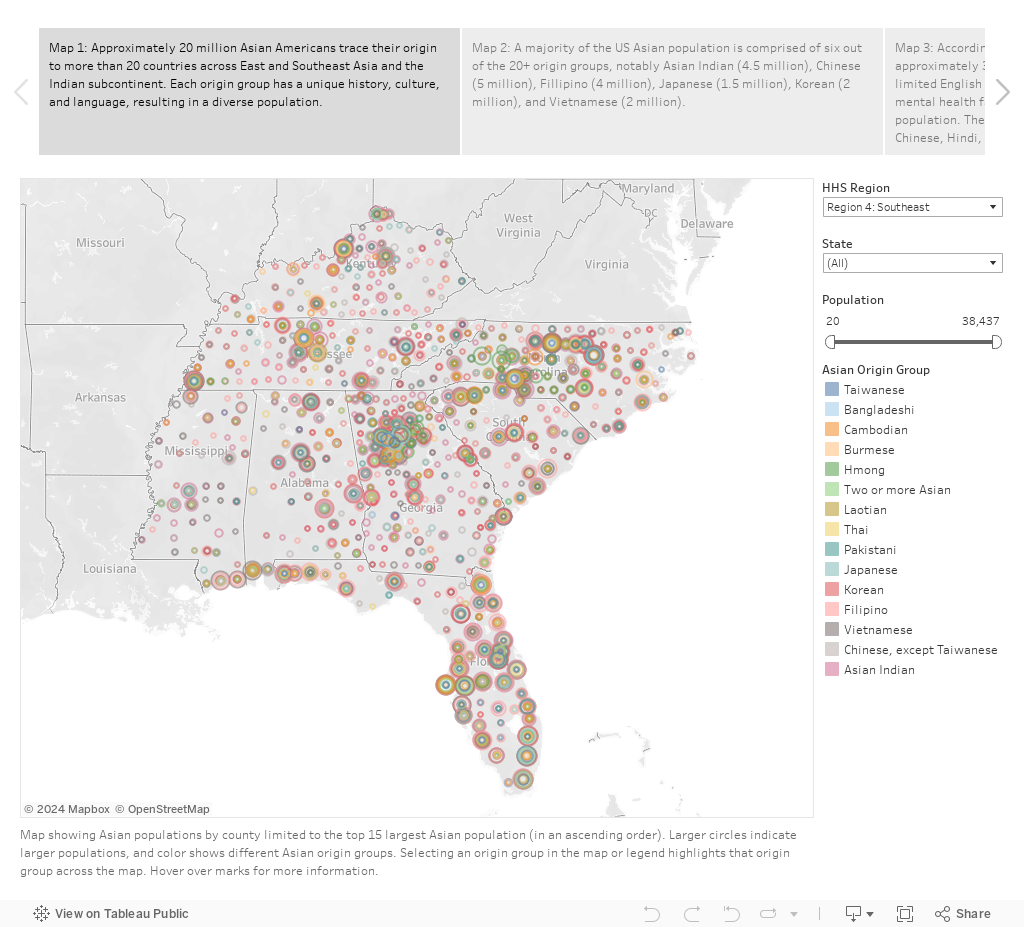
Map 1 shows population by county.
Map 2 shows distribution of people identifying as Asian.
Map 3 shows mental health facilities offering language services.
References for data sources are provided in the last tab.